Covid-19 Testing and Tracking
Auburn tracks positive cases reported through multiple sources:
Self-reported data (including data from current students, employees and third-party contractors) who report testing positive for COVID-19, regardless of testing location
Auburn University Medical Clinic data which tests Auburn students, facuty, staff and community members.
Testing information is compiled weekly (Monday–Sunday) when classes are in session and posted to the CRC site each week. New data will be published the week of January 17, 2022.
The university requires all current students and employees who test positive for COVID-19, regardless of testing location, to complete a confidential Self-Report Form. Self-reported data includes those reports submitted by students, faculty, staff and third-party contractors working on campus who have tested positive for COVID-19.
The Self-Report Form is how an individual notifies Auburn University, through the COVID Resource Center, about their test result. Submission of the form enables the university to help reduce exposure among the campus community by providing necessary contact tracing and follow-up care.
Note: Total positive cases include self-reported numbers from Auburn students, employees and contractors. Auburn University Medical Clinic numbers are not added to this number as they include cases that were self-reported and individuals that are not part of the Auburn campus community.
| Reporting Week | Positive Results |
|---|---|
| Jan. 10-16 | 445 |
| Jan. 3-9 | 183 |
| Reporting Week | Positive Results |
|---|---|
| Dec. 6-12 | 13 |
| Nov. 29-Dec. 5 | 22 |
| Nov. 22-28 | 8 |
| Nov. 15-21 | 17 |
| Nov. 8-14 | 8 |
| Nov. 1-7 | 9 |
| Oct. 25-31 | 8 |
| Oct. 18-24 | 8 |
| Oct. 11-17 | 20 |
| Oct. 4-10 | 21 |
| Sept. 27-Oct. 3 | 26 |
| Sept. 20-26 | 43 |
| Sept. 13-19 | 60 |
| Sept. 6-12 | 100 |
| Aug. 30-Sept. 5 | 188 |
| Aug. 23-29 | 360 |
| Aug. 16-22 | 424 |
| Reporting Week | Positive Results |
|---|---|
| Aug. 9-15 | 67 |
| Aug. 2-8 | 43 |
| July 26-Aug. 1 | 21 |
| July 19-25 | 10 |
| July 12-18 | 4 |
| July 5-11 | 0 |
| June 28-July 4 | 1 |
| June 21-27 | 3 |
| June 14-20 | 1 |
| June 7-13 | 0 |
| May 31-Jun. 7 | 1 |
| May 24-30 | 4 |
| May 19-23 | 2 |
| Reporting Week | Positive Results |
|---|---|
| April 26-May 2 | 3 |
| April 19-25 | 6 |
| April 12-18 | 7 |
| April 5-11 | 15 |
| March 29-April 4 | 6 |
| March 22-28 | 24 |
| March 15-21 | 8 |
| March 8-14 | 7 |
| March 1-7 | 13 |
| Feb. 22-28 | 16 |
| Feb. 15-21 | 12 |
| Feb. 8-14 | 32 |
| Feb. 1-7 | 94 |
| Jan. 31 | 75 |
| Jan. 24 | 78 |
| Jan. 17 | 113 |
| Jan. 10 | 58 |
| Reporting Week | Positive Results |
|---|---|
| Dec. 13 | 16 |
| Dec. 6 | 25 |
| Nov. 29 | 18 |
| Nov. 22 | 15 |
| Nov. 15 | 23 |
| Nov. 8 | 24 |
| Nov. 1 | 8 |
| Oct. 25 | 17 |
| Oct. 18 | 11 |
| Oct. 11 | 16 |
| Oct. 4 | 21 |
| Sept. 27 | 17 |
| Sept. 20 | 53 |
| Sept. 13 | 109 |
| Sept. 6 | 598 |
| Aug. 30 | 570 |
Auburn University Medical Clinic operates on campus to provide medical care to Auburn students, staff, faculty and community members. As the clinic is a part of the East Alabama Medical Center, health records are confidential and not shared with the university. Patients are encouraged to self-report positive COVID-19 test results to the university, but not all patients are Auburn students, faculty or staff.
| Reporting Week | Tests Taken | Positive Results | Positivity Rate |
|---|---|---|---|
| Jan. 10-14 | 1132 | 371 | 32.8 % |
| Jan. 3-7 | 904 | 292 | 32% |
| Reporting Week | Tests Taken | Positive Results | Positivity Rate |
|---|---|---|---|
| Dec. 13-17 | 253 | 9 | 3.5 % |
| Dec. 6-10 | 430 | 12 | 2.7% |
| Nov. 29-Dec. 3 | 508 | 18 | 3.5% |
| Nov. 22-26 | 83 | 1 | 1.2% |
| nov. 15-19 | 407 | 4 | 1% |
| Nov. 8-12 | 301 | 5 | 1.6% |
| Nov. 1-5 | 391 | 0 | 0% |
| Oct. 25-29 | 263 | 5 | 2% |
| Oct. 18-22 | 314 | 5 | 2% |
| Oct. 11-15 | 442 | 5 | 2% |
| Oct. 4-8 | 410 | 7 | 1% |
| Sept. 27-Oct. 1 | 1048 | 11 | 2% |
| Sept. 20-24 | 454 | 25 | 1% |
| Sept. 13-17 | 682 | 20 | 5.5% |
| Sept. 6-10 | 537 | 30 | 3% |
| Aug. 30-Sept. 4 | 717 | 80 | 5.5% |
| Aug. 23-27 | 701 | 122 | 11% |
| Aug. 16-20 | 620 | 133 | 17% |
| Reporting Week | Tests Taken | Positive Results | Positivity Rate |
|---|---|---|---|
| Aug. 9-15 | 571 | 30 | 7.9 % |
| Aug. 2-6 | 392 | 31 | 10.8% |
| July 26-30 | 231 | 25 | 10.2% |
| July 19-23 | 118 | 12 | 9.3% |
| July 12-16 | 86 | 8 | 9.1% |
| July 5-9 | 44 | 4 | 7.0% |
| June 28-July 2 | 57 | 4 | 0.0% |
| June 21-25 | 70 | 0 | 3.1% |
| June 14-18 | 64 | 2 | 2.4% |
| June 7-11 | 42 | 1 | 2.2% |
| May 31-June 4 | 45 | 1 | 7.7% |
| May 24-28 | 65 | 5 | 3.4% |
| May 17-21 | 87 | 3 | 4.6% |
| May 10-14 | 86 | 4 | 2.6% |
| May 3-10 | 115 | 3 | 1.77% |
| Reporting Week | Tests Taken | Positive Results | Positivity Rate |
|---|---|---|---|
| Apr. 26-May 2 | 338 | 6 | 0.05 % |
| Apr. 19-25 | 156 | 8 | 6.17% |
| Apr. 12-18 | 162 | 10 | 4.83% |
| Apr. 5-11 | 186 | 9 | 3.6% |
| Mar. 29-Apr. 4 | 274 | 10 | 4.8% |
| Mar. 22-28 | 208 | 10 | 1.8% |
| Mar. 15-21 | 220 | 4 | 2.6% |
| Mar. 8-14 | 229 | 6 | 5.9% |
| Mar. 1-7 | 319 | 19 | 5.05% |
| Feb. 22-28 | 336 | 17 | 4.5% |
| Feb. 15-21 | 349 | 16 | 7.3% |
| Feb. 8-14 | 505 | 37 | 11.1% |
| Feb. 1-7 | 604 | 67 | 13.6% |
| Jan. 25-31 | 659 | 90 | 12.2% |
| Jan. 18-24 | 548 | 67 | 10.6% |
| Jan. 11-17 | 818 | 87 | % |
The university is currently in phase 3 of vaccination distribution. Read more information about the Covid-19 vaccine.
as of January 19, 2022
Data displayed represents the average number of students in quarantine and isolation housing for the week indicated.
| Reporting Week | Avg. in quarantine | Avg. in isolation | Quarantine in Place |
|---|---|---|---|
| Dec. 6-12 | 0 | 0 | 0 |
| Nov. 29-Dec. 5 | 0 | 0 | 0 |
| Nov. 22-26 | 0 | 0 | 0 |
| Nov. 15-19 | 0 | 0 | 0 |
| Nov. 8-12 | 0 | 0 | 0 |
| Nov. 1-5 | 0 | 0 | 0 |
| Oct. 25-29 | 0 | 0 | 0 |
| Oct. 18-22 | 0 | 0 | 0 |
| Oct. 11-15 | 0 | 0 | 0 |
| Oct.4-8 | 0 | 0 | 0 |
| Sept. 27-Oct. 3 | 0 | 0 | 0 |
| Sept. 20-26 | 0 | 0 | 0 |
| Sept. 13-19 | 0 | 0 | 0 |
| Sept. 6-12 | 0 | 0.5 | 0.5 |
| Aug. 30-Sept. 5 | 0 | 1 | 0.5 |
| Aug. 23-29 | 0.5 | 11 | 3.5 |
| Aug. 16-22 | 4 | 18 | 3 |
| Aug. 9-15 | 0.5 | 22 | 13.5 |
Facilities Management maintains a comprehensive dashboard with information for campus facilities. The information is updated regularly.
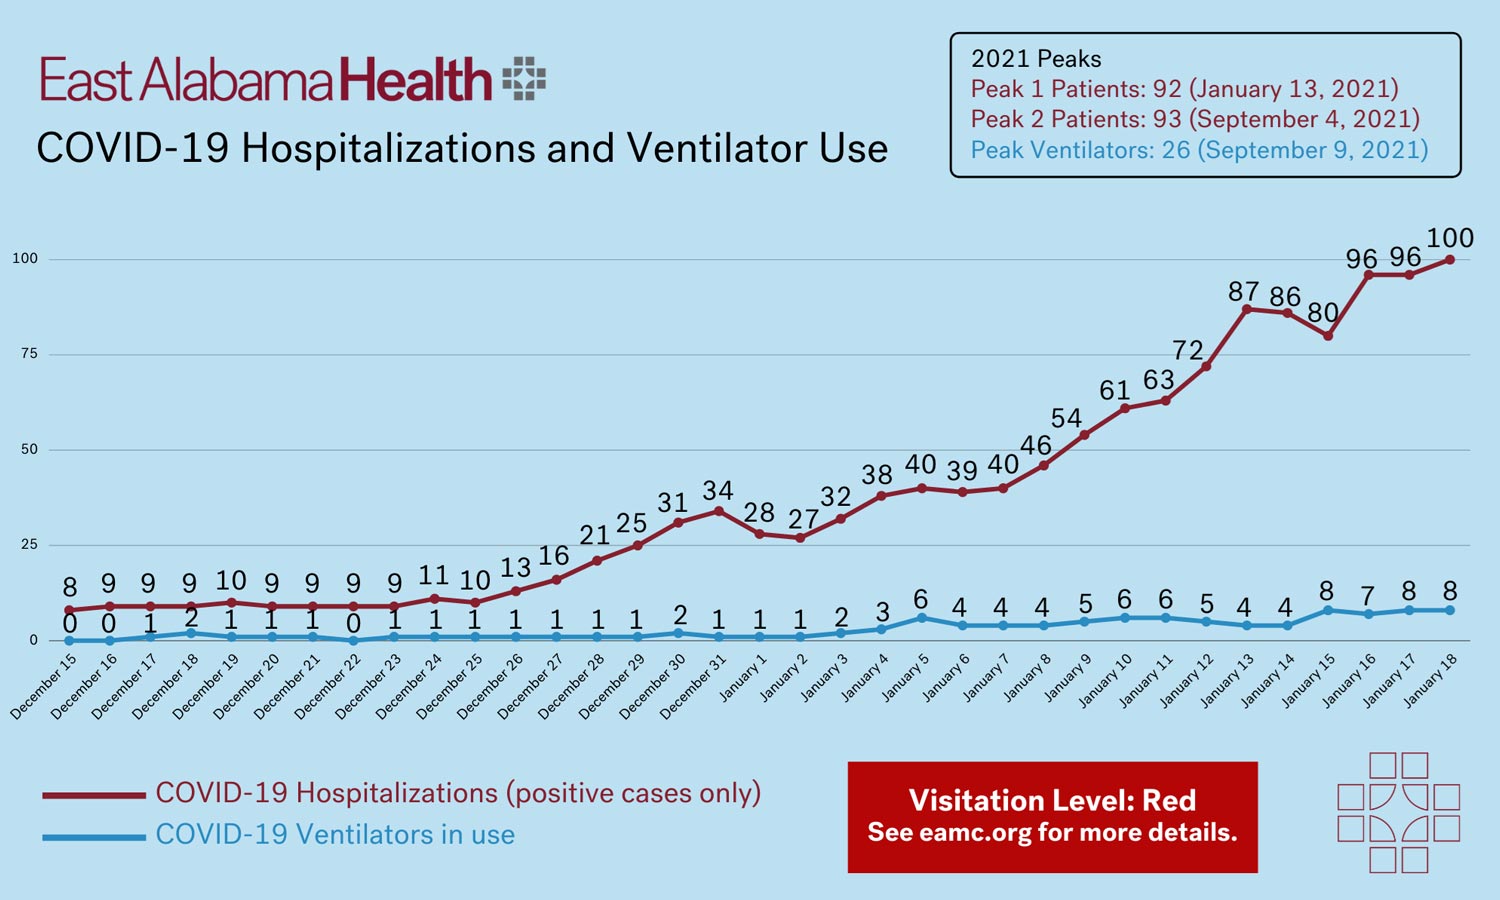
East Alabama Health Covid-19 Hospitalizations and Ventilator Use
Monitoring of community-level data in the Auburn community is focused on hospital capacity and case trends. University leadership is especially mindful of the need to help East Alabama Health avoid overburdening the health care system. Since the beginning of the pandemic, the university has worked closely with East Alabama Health and the Alabama Department of Public Health to share data, resources and plans. Read latest updates on East Alabama Health's Facebook page.