--James N. Boyer and David B. South
INTRODUCTION
A seedling crop presents special soil management problems. The entire crop, including the roots, is harvested. Consequently, the continuing production of quality pine seedlings requires careful replacement of lost nutrients and maintenance of organic matter and soil tilth. The Auburn University Southern Forest Nursery Management Cooperative has been instrumental in improving soil testing practices and interpreting test results from southern forest nurseries through the Southern Forest Nursery Soil Testing Program (9). However, in addition to soil analysis for nutrient levels, analysis of the seedlings themselves for nutrient levels, analysis of the seedlings themselves for nutrient content can be an invaluable aid in soil management.
Plant analysis is playing an increasingly important role in the expanding technology of economic plant production (1). The chemical composition of foliage and other plant parts indicates the amounts of minerals removed from the soil and is a tool for diagnosing nutritional deficiencies (3). While nutrient removal data have certain limitations, they do serve as estimates of the magnitude of the soil nutrient loss (6).
A combination of both soil and tissue analyses can be much more useful than either one alone (5). Because tissue analysis does not rely so heavily on arbitrary extraction procedures, it can be useful for calibrating soil test values (11). One problem with the use of plant analysis as a management tool is the lack of suitable reference standards (1). The objective of the research on which this publication is based was to provide ranges of nutrient levels which seedling producers may use to compare the nutritional status of their loblolly pine (Pinus taeda L.) Seedlings with that of seedlings sampled during 2 years at a large number of nurseries.
MATERIALS AND METHODS
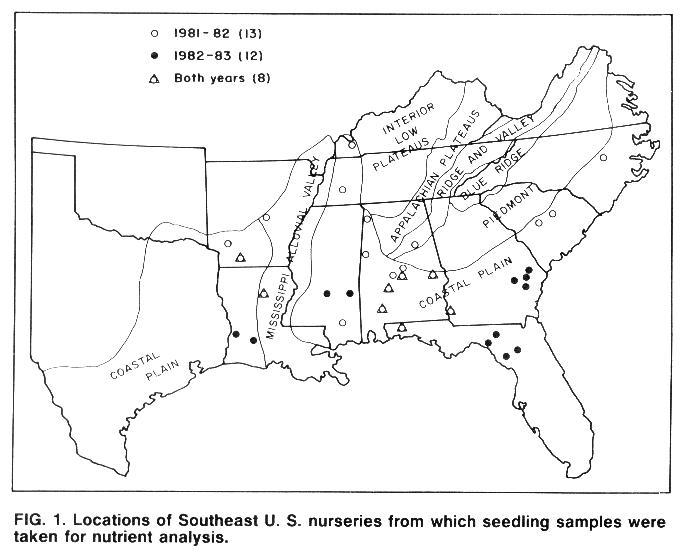
From late November 1981 to late January 1982, 21 forest nurseries in 10 Southern States were visited to sample loblolly pine seedlings in production at that time. In December 1982, 20 nurseries in six states were visited, including eight which had been sampled the previous season, figure 1. Random nurseries were visited the first year and samples representing many seed sources were chosen from an average area in the nursery. The second year, only nurseries which sowed Livingston Parish (Louisiana) seed were visited, and an average area within that seed source was sampled.
At each nursery, one linear bed-foot sample (4 square feet) of 1-0 seedlings was hand-lifted. The sample was separated into foliage, stems, and roots. The plant components were oven-dried, weighed, and chemically analyzed, table 1.
Table 1. Description of methods employed for tissue Nutrient Analysis1
|
ELEMENT |
METHOD |
| N..................................... | Kjeldahl digestion with H2SO4 K2SO2-Hg catalyst, distillation into standard acid and titration. |
|
P..................................... |
Dry ashed at 500EC and dissolved in 1:1 HCI. Phosphorus in extract determined colorimetrically. |
|
Ca, Mg, K, Na, Zn, Mn,Fe, Cu, Al................ |
Dry ashed at 500EC and dissolved in 1:1 HCI. Metals in extract determined by atomic absorption. |
|
S.................................... |
Sample ashed with Mg (NO3)2. Sulfate in ash determined by BaSO4 precipitation. |
|
B.................................... |
Dry ashed at 500EC and dissolved in 1:1 HCI. Boron in extract determined by Azomethine-H colorimetric method. |
1Analyses performed by A&L Laboratories, Memphis, Tennessee.
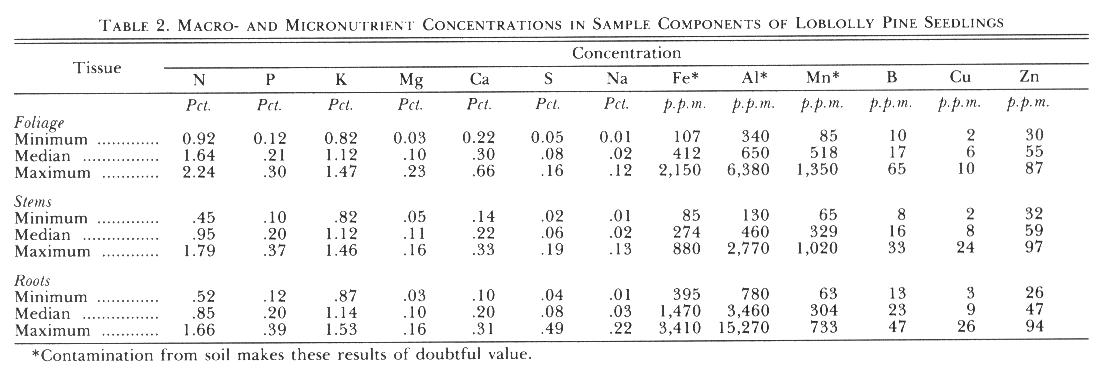
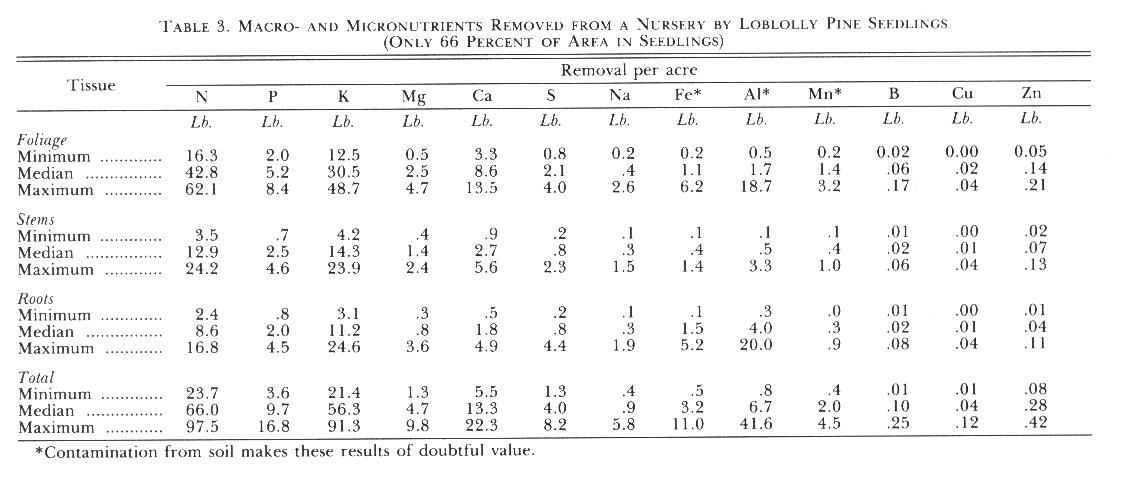
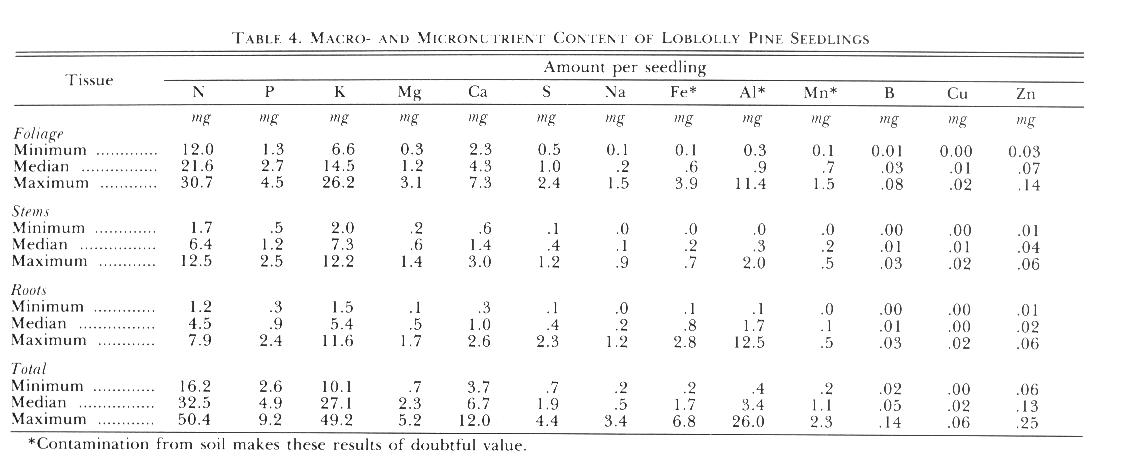
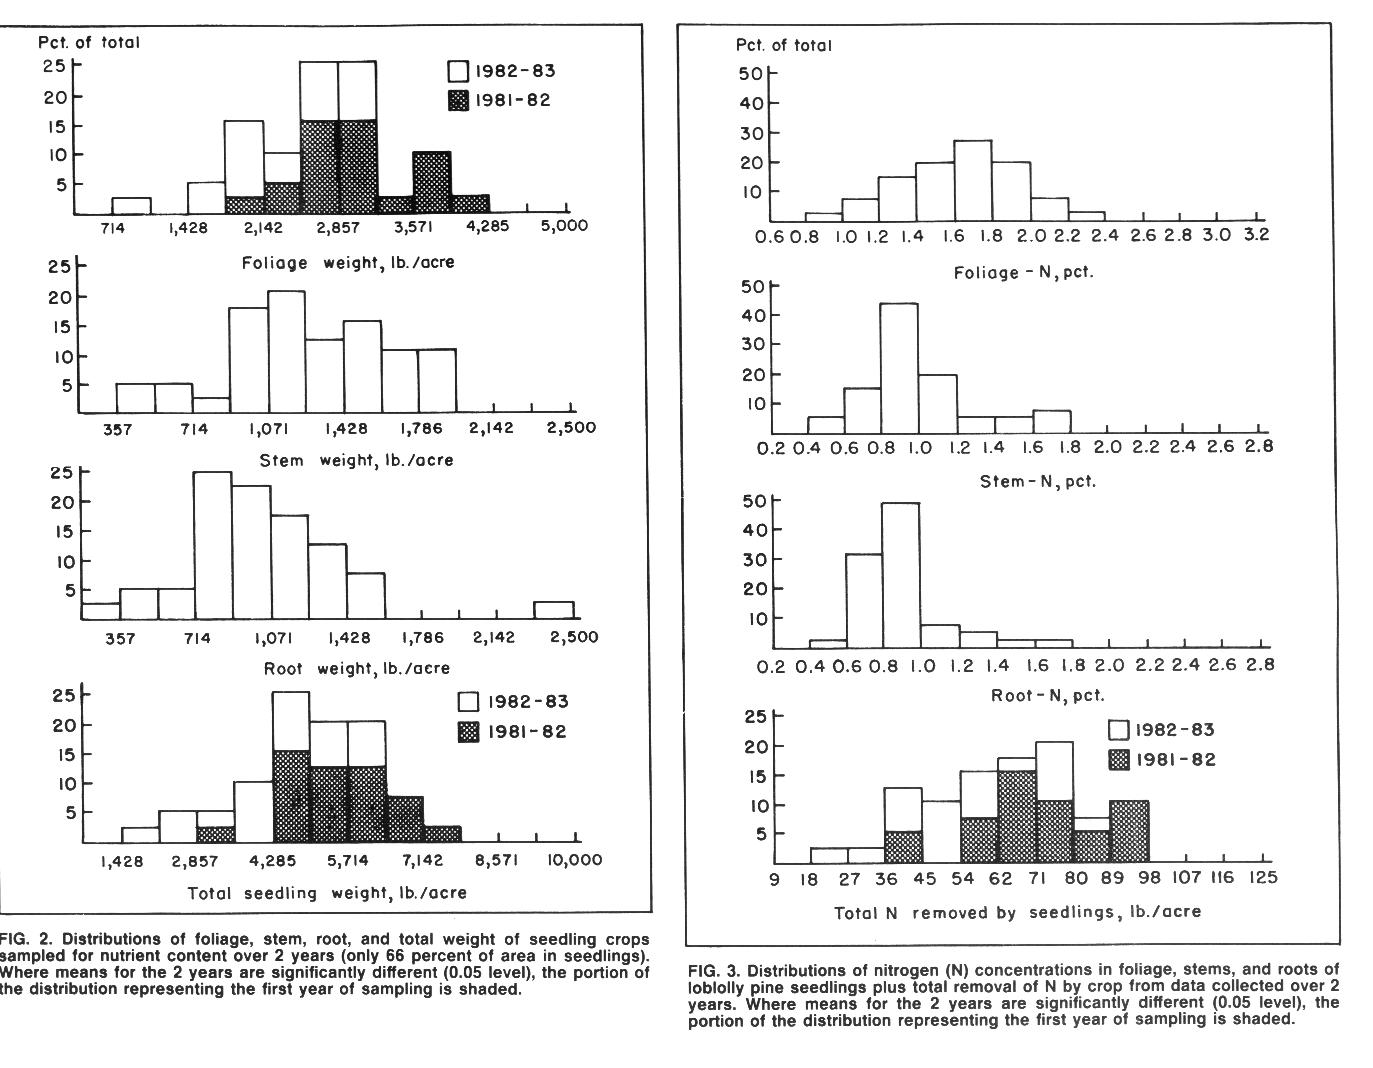
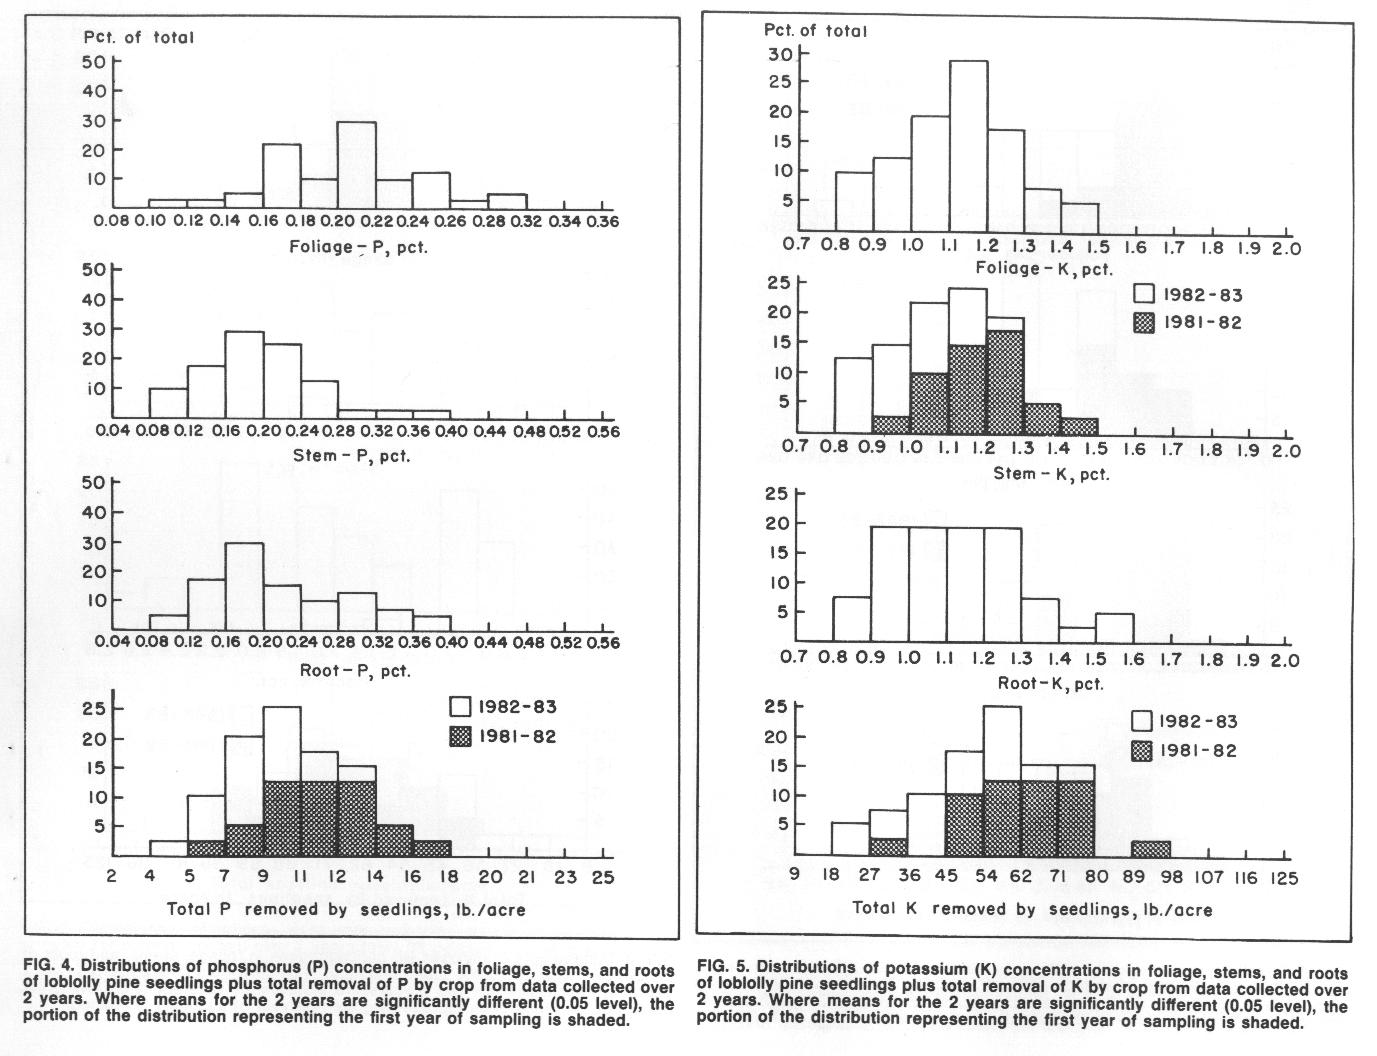
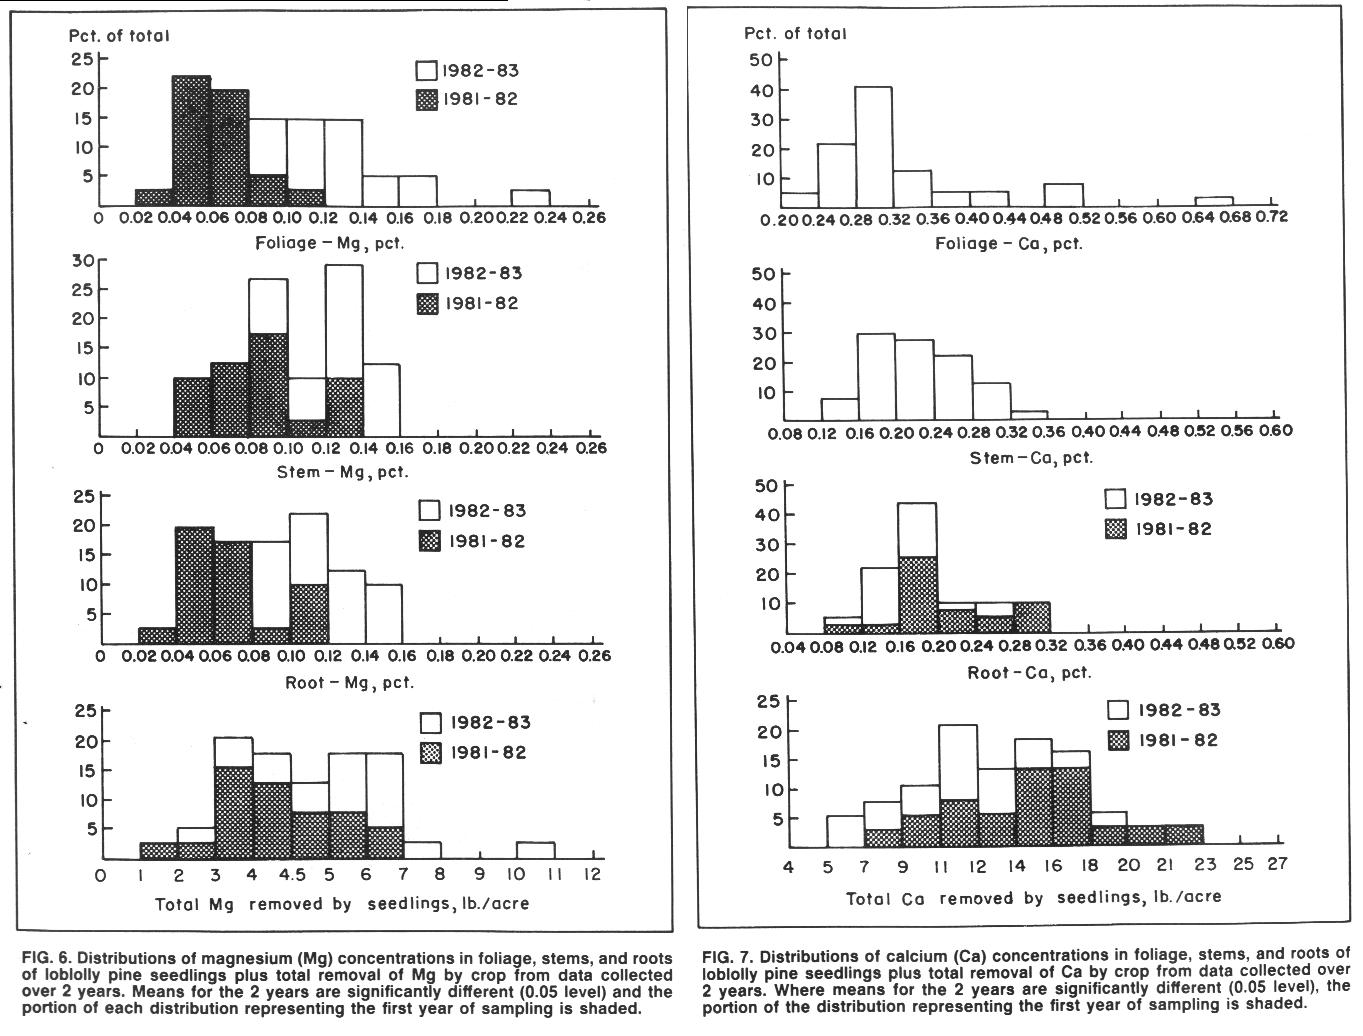
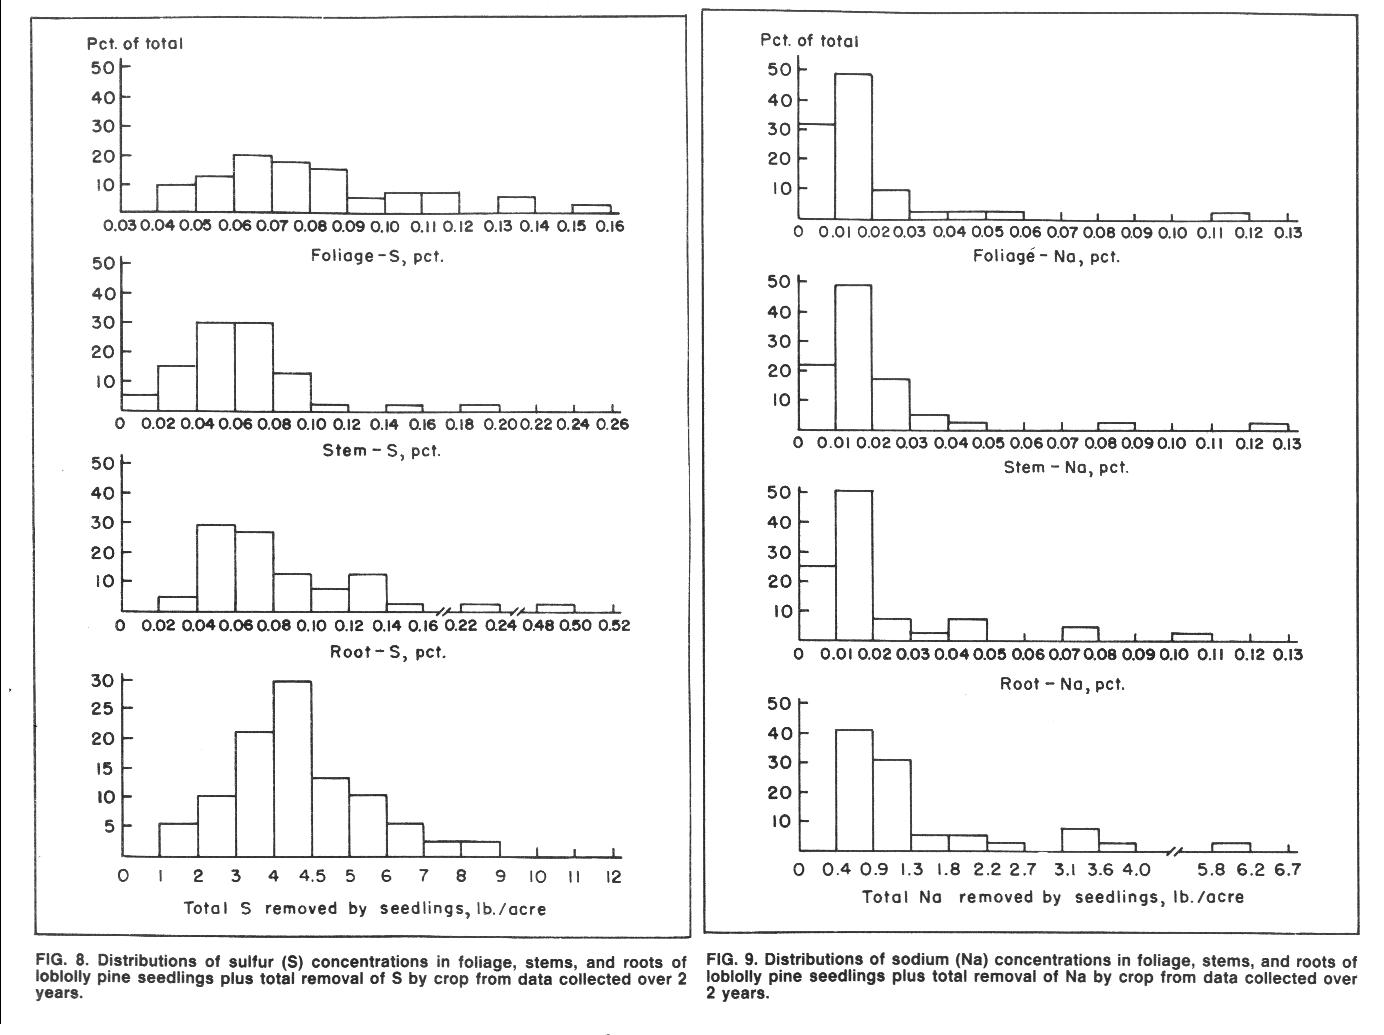
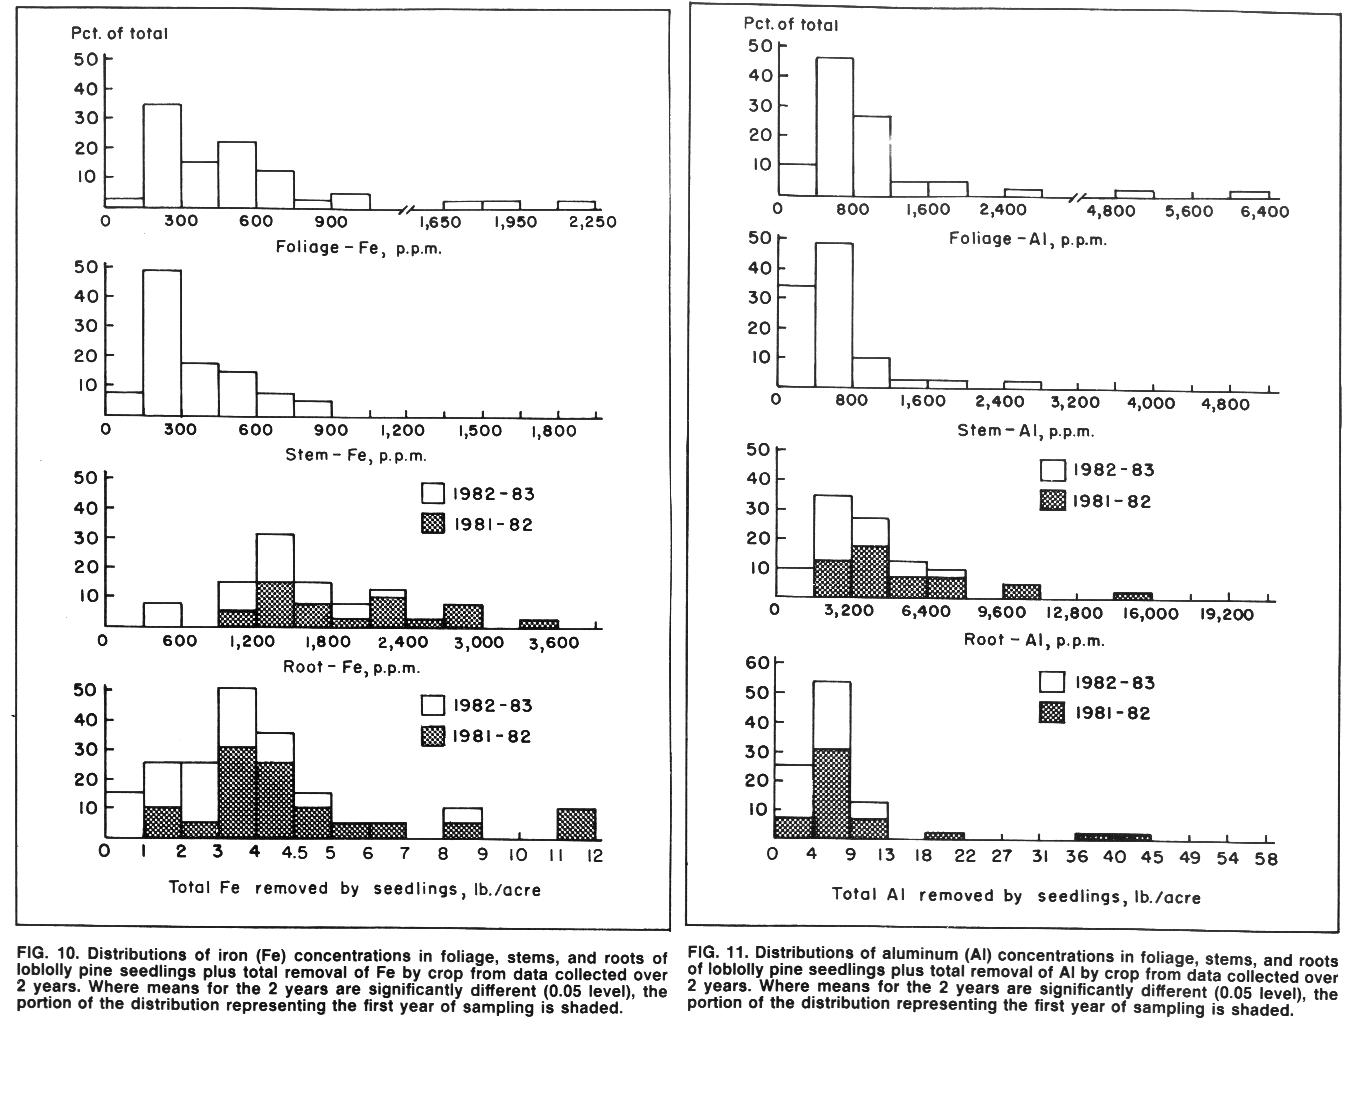
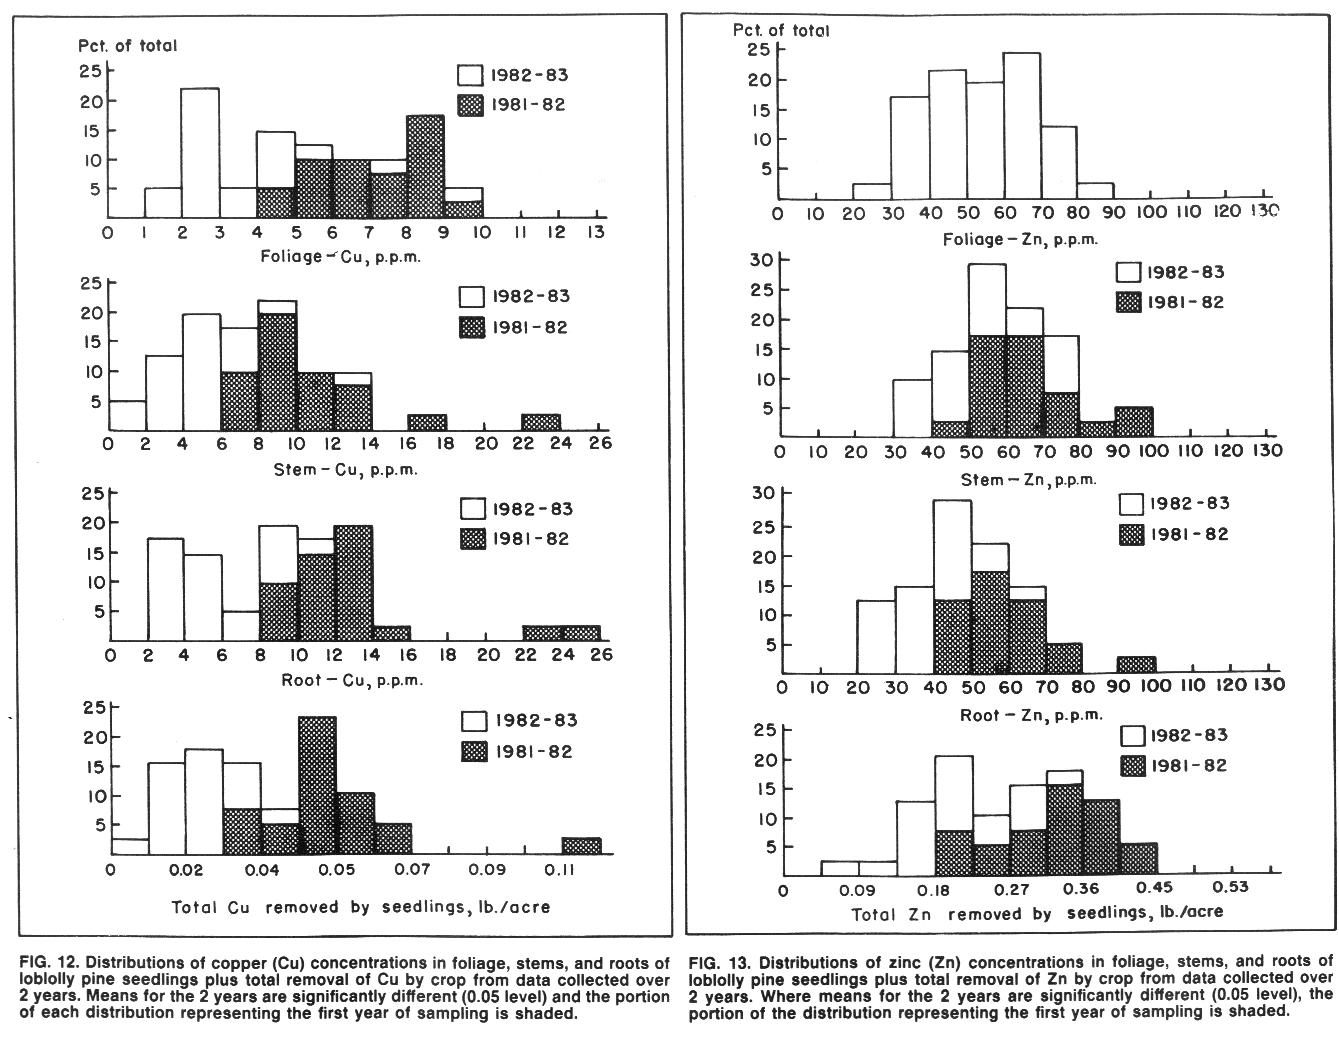
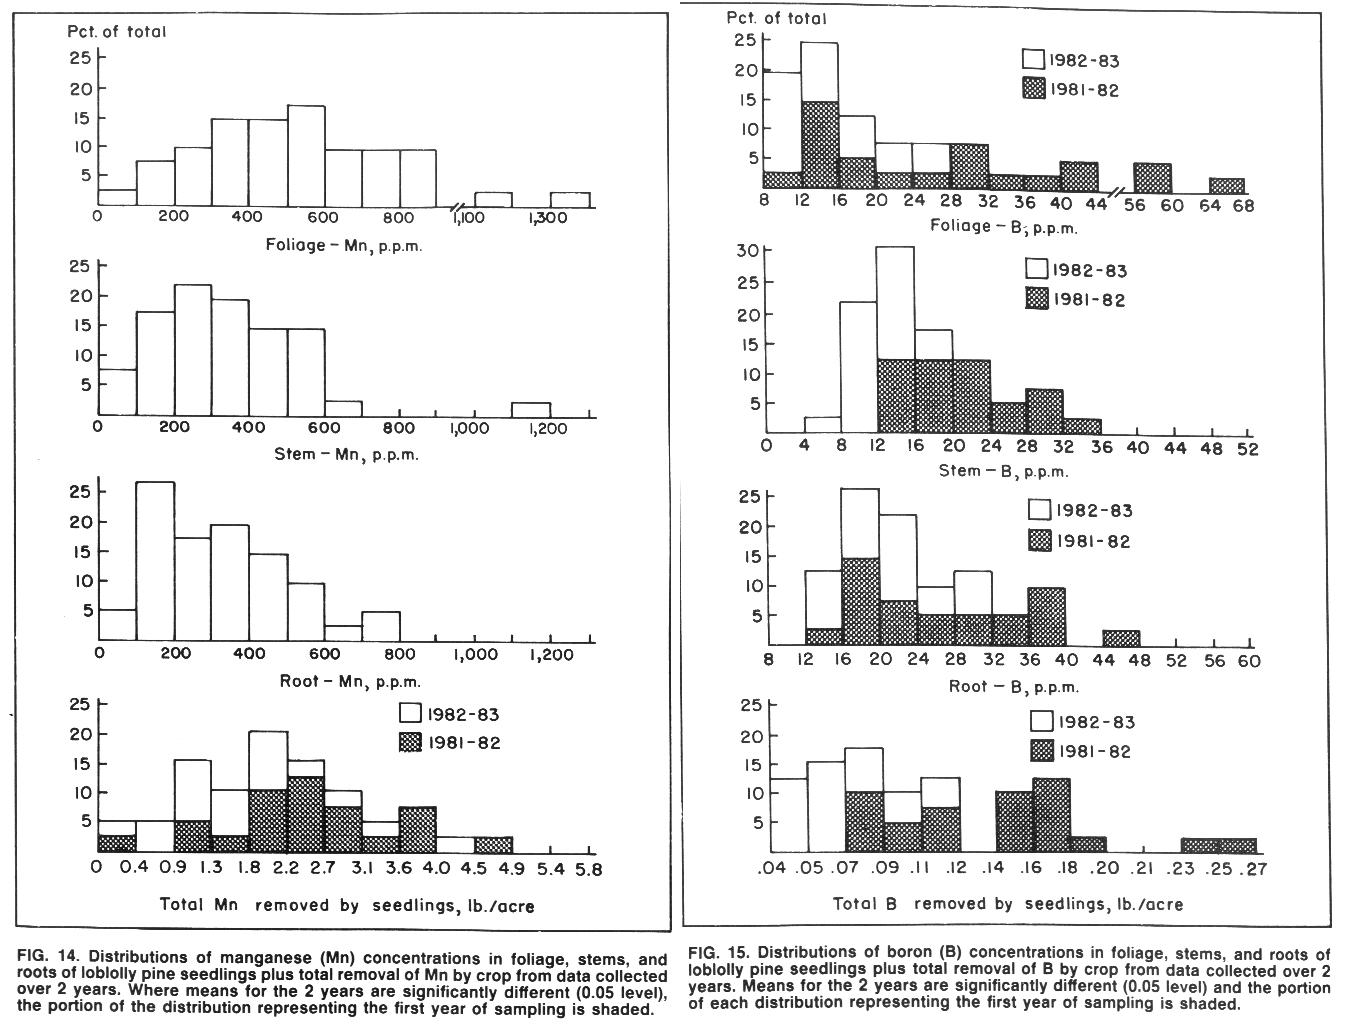
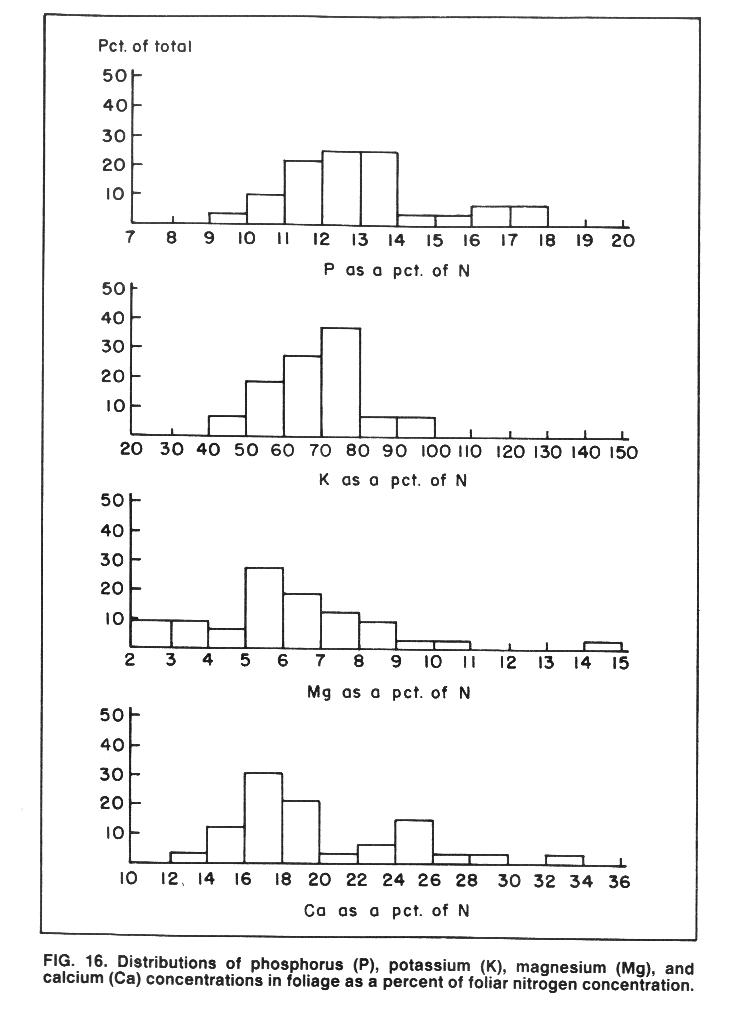
Nutrient levels are reported as a percent of dry weight or as parts per million by dry weight (p.p.m.). The median, minimum, and maximum values for these data are listed in table 2 for the different plant components. From these data and plant dry weights, calculations were made of the pounds per acre (total area, including tractor paths) of each soil nutrient removed from the soil by the seedling crop. The median, minimum, and maximum values for soil nutrient removal are listed in table 3. Table 4 shows nutrient removal values as milligrams per seedling. Histograms are used to show the distributions of seedling dry weights, figure 2, nutrient levels for each plant component, and the total amount of each nutrient removed from the soil, figures 3-15. Bar heights in these figures refer to the percent of the total number of samples having that value. Histograms are also used to show the foliar concentrations of phosphorus, potassium, magnesium, and calcium relative to nitrogen concentration, figure 16. Only foliage samples with more than 1.2 percent and less than 2.0 percent nitrogen were included in this figure. Where means for the two sampling seasons are significantly different, the portion of the distribution representing the first year of sampling is shaded.
RESULTS AND DISCUSSION
Nutrient concentrations reported for this survey are generally comparable to values found elsewhere, although some differences may occur due to varying methods used for analysis. Most studies of plant nutrient content involve only the foliage. Furthermore, while studies usually report nutrient concentration in the tissue, it is important for the nurseryman to think in terms of soil nutrient depletion by plant removal. This information, together with soil test results and information on leaching amounts and the relationship between plant nutrient concentrations and productivity, can help the nurseryman manage for soil fertility more efficiently. Furthermore, absolute levels of nutrients taken by themselves may not be as important as the ratios of one element to another. This publication provides distributions of not only the nutrient concentrations in the various plant parts, but also of the total amount of nutrients removed from the soil. While these data do not show what concentrations are optimum for seedling production, they do give the nurseryman an indication of where his nursery may stand in relation to other nurseries with regard to plant nutrient levels and removals.
Most data for nutrient levels in southern pine seedlings have arisen form studies where soil fertility levels were varied. Results from this survey show the distributions of nutrients in seedlings produced operationally at nurseries throughout the South over two growing seasons.
More nitrogen was removed from the soil by loblolly pine seedlings than any other nutrient, although potassium was a close second, table 3. In foliage, the concentration of nitrogen was higher than potassium, however, stems and roots contained more of the latter, table 2. Nitrogen and potassium together made up nearly three-fourths (73 percent) of total element removal. Calcium was the next most abundant element n plant tissues, followed by phosphorus. Many samples were abnormally high in iron, aluminum, and manganese, apparently due to soil contamination.
Fowells and Krauss (2) reported that less than 1.2 percent nitrogen and less than 0.10 percent phosphorus in loblolly pine foliage were deficient levels. Sucoff (10) reported the same deficiency levels for these nutrients in Virginia pine (Pinus virginiana Mill.) foliage. According to these standards and deficiency levels for potassium, calcium, and magnesium listed by Sucoff (10), a few samples in this survey were deficient in nitrogen, while none was deficient in phosphorus, potassium, or calcium. However, many nurseries were deficient in magnesium. Fowells and Krauss (2) also reported that trees grow best with foliar concentrations of 1.7-2.3 percent nitrogen and 0.14-0.18 percent phosphorus. Higher concentrations represent luxury consumption. Most samples in this survey were below this level of nitrogen but above the phosphorus level. Munson and Stone (7) pointed out the need for a clearer definition of minimum levels of potassium in nursery seedlings. Moisture stress seems to be the major cause of planting failures in the South, and potassium concentration is related to drought tolerance (4).
Information on the proper ratio of one element to another is scarce. Shear et al. (8) dealt with this subject in some depth, but little if any work has been done on nutrient balance in loblolly pine. Shear et al. (8) stated that maximum growth and yield occur only upon the coincidence of optimum nutrient intensity and balance. Figure 16 shows the ratios of phosphorus, potassium, magnesium, and calcium to nitrogen. The data are displayed as percent of nitrogen concentration. For some samples, the data suggest that certain nutrients may not be in the correct balance.
The time of year sampling for nutrient content is done can have a major effect on results. The tissue nutrient concentrations of actively growing plants will be quite different from those of dormant plants. Furthermore, nutrient status of loblolly pine seedlings may also change over the course of the dormant period of lifting season. Munson and Stone (7) showed that nitrogen, phosphorus, calcium, and magnesium concentrations remained relatively constant during the lifting season (November - March), while potassium concentration progressively declined. However, due to increasing seedling dry weight during the latter part of the lifting season (January - March), total seedling nutrient content increased significantly for all elements during this period. Their soil nutrient removal values for the January lifting were slightly to substantially higher than these findings, table 3. In order to accurately reflect actual soil nutrient removal, sampling for plant analysis should coincide with the most active period of lifting.
FIGURES for P/N K/N Mg/N and Ca/N ratios
CONCLUSION
Seedling concentrations of nitrogen, phosphorus, potassium, and calcium reported for this survey are generally comparable with values previously reported in the literature. However, the range of values for magnesium and sodium are generally lower than values reported elsewhere. This may well be due to a difference in quantification procedures. Previous data for micronutrient concentrations in pine seedlings are scarce. In addition to nutrient concentrations in plant tissues, nursery managers should also be concerned with the magnitude of the drain on soil nutrients by seedling removal.
This survey gives nursery managers the opportunity to compare the nutrient status of their seedlings with that from other nurseries in the South. To make such a comparison, a nursery manager should: (1) sample seedlings at the end of the growing season, preferably in December; (2) harvest an average area of seedlings (include tractor paths in area calculation), carefully was soil from roots, oven-dry and weigh foliage, stems, and roots separately, and calculate pounds per acre for the plant parts; (3) send the separate components (from about 30 seedlings) to a laboratory for analysis (the same laboratory each time); (4) multiply the concentration value for each component by its weight value to get the amount of nutrients removed by that component; and (5) add the three components to determine the total element removal from an acre of soil.
LITERATURE CITED
(1) Aldrich, S. R. 1973. Plant Analysis: Problems and Opportunities, pp. 213-221. In Walsh, L. M. And J. D. Beaton. Soil Testing and Plant Analysis. Soil Sci. Soc. Of Amer. Madison, Wisc.
(2) Fowells, H. A. and R. W. Krauss. 1959. The Inorganic Nutrition of Loblolly Pine and Virginia Pine with Special Reference to Nitrogen and Phosphorus. For. Sci. 5:95-112.
(3) Goodall, D. W. and F. G. Gregory. 1947. Chemical Composition of Plants as an Index of Their Nutritional Status. Imp. Bur. Hort. and Plantation Crops. Tech. Comm. No. 17. E. Malling, Kent, England.
(4) Larsen, B. J. 1978. Investigations on the Significance of Potassium and Nitrogen Supply for the Desiccation of Douglas-fir (Pseudotsuga menziesii) in Winter. Flora 167:197-207.
(5) Leaf, A. L. 1965. Soil and Tissue Analysis Methodology, pp. 67-72. In Proc. Nurs. Soil Improvement Sessions. State Univ. Coll. of For. at Syracuse Univ. Syracuse, N.Y.
(6) May, J. T., H. H. Johnson, and A. R. Gilmore. 1962. Chemical Composition of Southern Pine Seedlings. Ga. For. Res. Pap. 10. Ga. For. Res. Council. Macon, Ga.
(7) Munson, K. R. and E. L. Stone. 1984. Seedling and Soil Nutrient Status During the Lifting Period in a North Florida Nursery. Proc. Western Sess. South. Nur. Conf. June 12-15, 1984. Alexandria, La. (In press.)
(8) Shear, C. B., H. L. Crane, and A. T. Myers. 1946. Nutrient-Element Balance: a Fundamental Concept in Plant Nutrition. Proc. Amer. Soc. Hort. Sci. 47:239-248.
(9) South, D. B. and C. B. Davey. 1983. The Southern Forest Nursery Soil Testing Program. Ala. Agr. Exp. Sta. Cir. 265. Auburn Univ., Ala.
(10) Sucoff, E. I. 1962. Potassium, Magnesium, and Calcium Requirement of Virginia Pine. Northeast For. Exp. Sta. Pap. 169.
(11) Youngberg, C. T. 1984. Soil and Tissue Analysis: Tools for Maintaining Soil Fertility. In Duryea, M. L. and T. D. Landis (eds.). Forest Nursery Manual: Production of Bareroot Seedlings. For. Res. Lab., Ore. State Univ., Corvallis. 386 pp. (Martinus Nijhoff/Dr. W. Junk Publishers, The Hague.)