


Research Report 23-01 
The Use of Chlorophyll Fluorescence to Assess Freeze Injury in Containerized Loblolly Pine Seedlings
Annakay Newell and Nina Payne
Table 1. Genetic families used in the study and their yearly average minimum winter temperature (MWT) at the seed source origin. Families that were planted in the stress facility were grouped into two according to similar MWT, while single families were planted at the outplanting site.
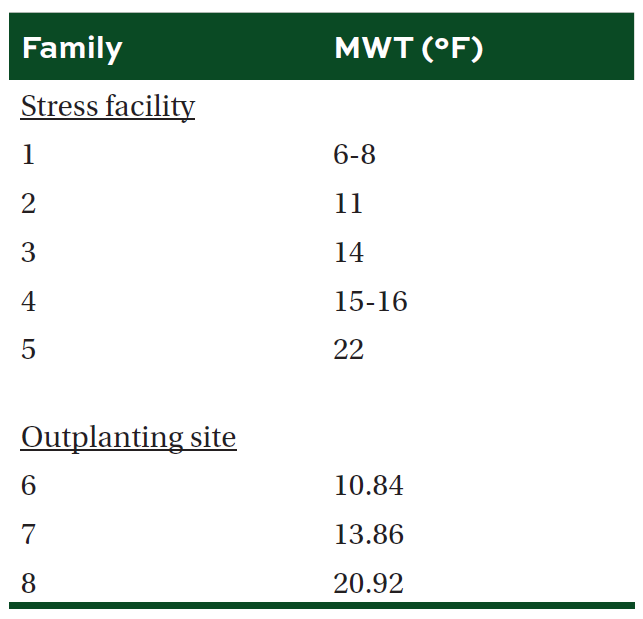
Table 2. Mean (±SE) change in root collar diameter (RCD) and height (HGT), and the ratio of variable to maximum fluorescence (FvFm) by treatment and family group in one-year old containerized loblolly pine seedlings planted in the stress facility. Different letters and bold indicate significant difference in means (α = 0.05).
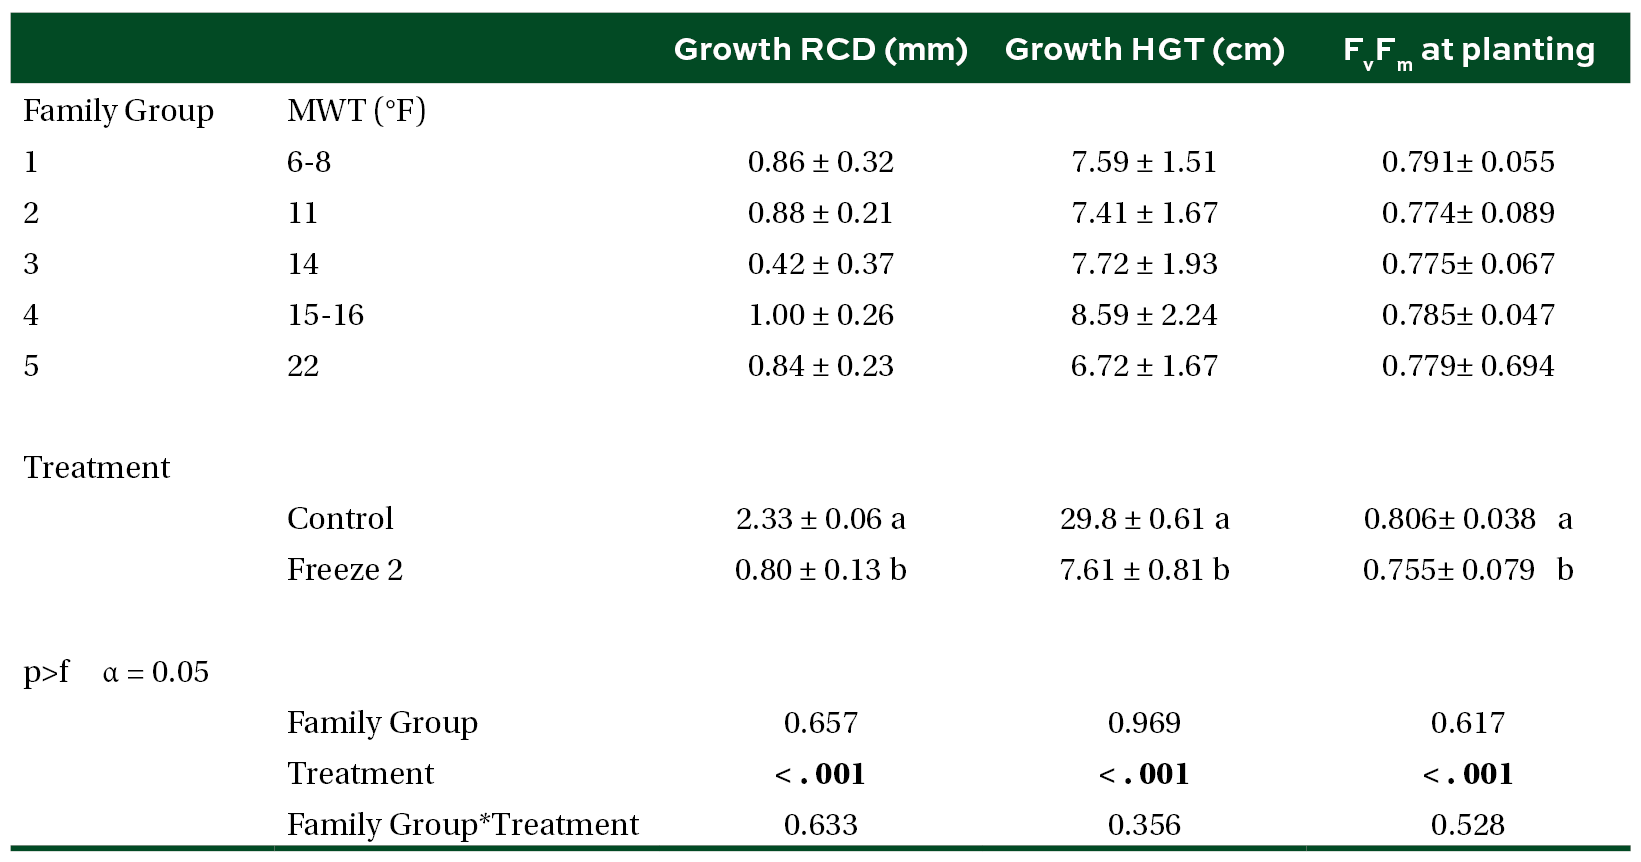
Table 3. Mean (±SE) mortality of seedlings planted at the stress facility by MWT groups, treatment, and planting time post experimental freeze. Different letters and bold indicate significant difference in means (α = 0.05).
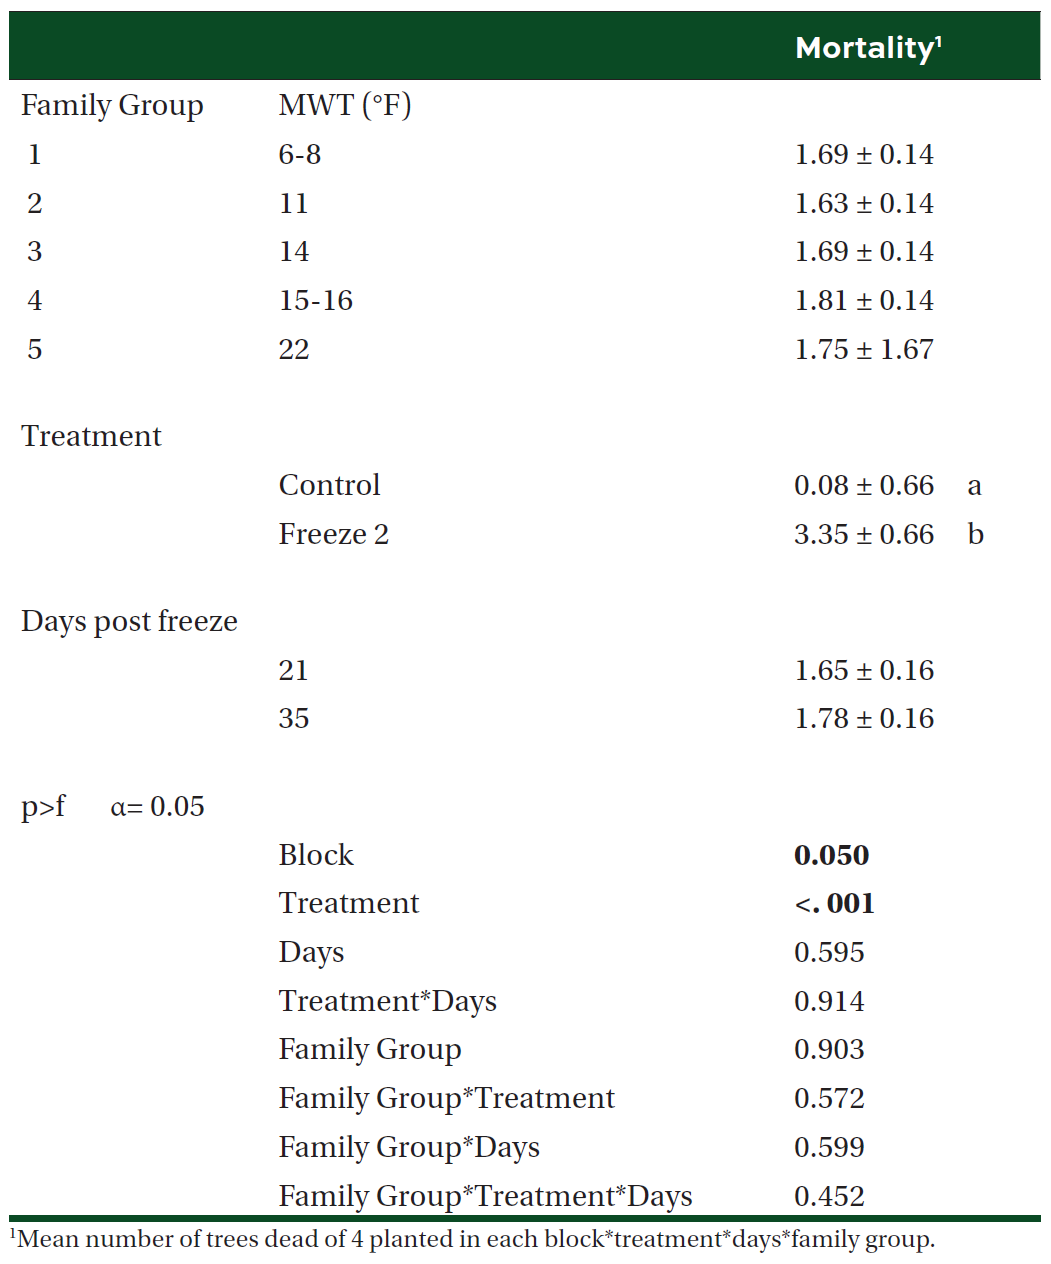
Table 4. Mean (±SE) change in root collar diameter (RCD) and height (HGT), and the ratio of variable to maximum fluorescence (FvFm) by treatment and family in one-year old containerized loblolly pine seedlings planted at the outplanting site. Different letters and bold indicate significant difference in means (α = 0.05).
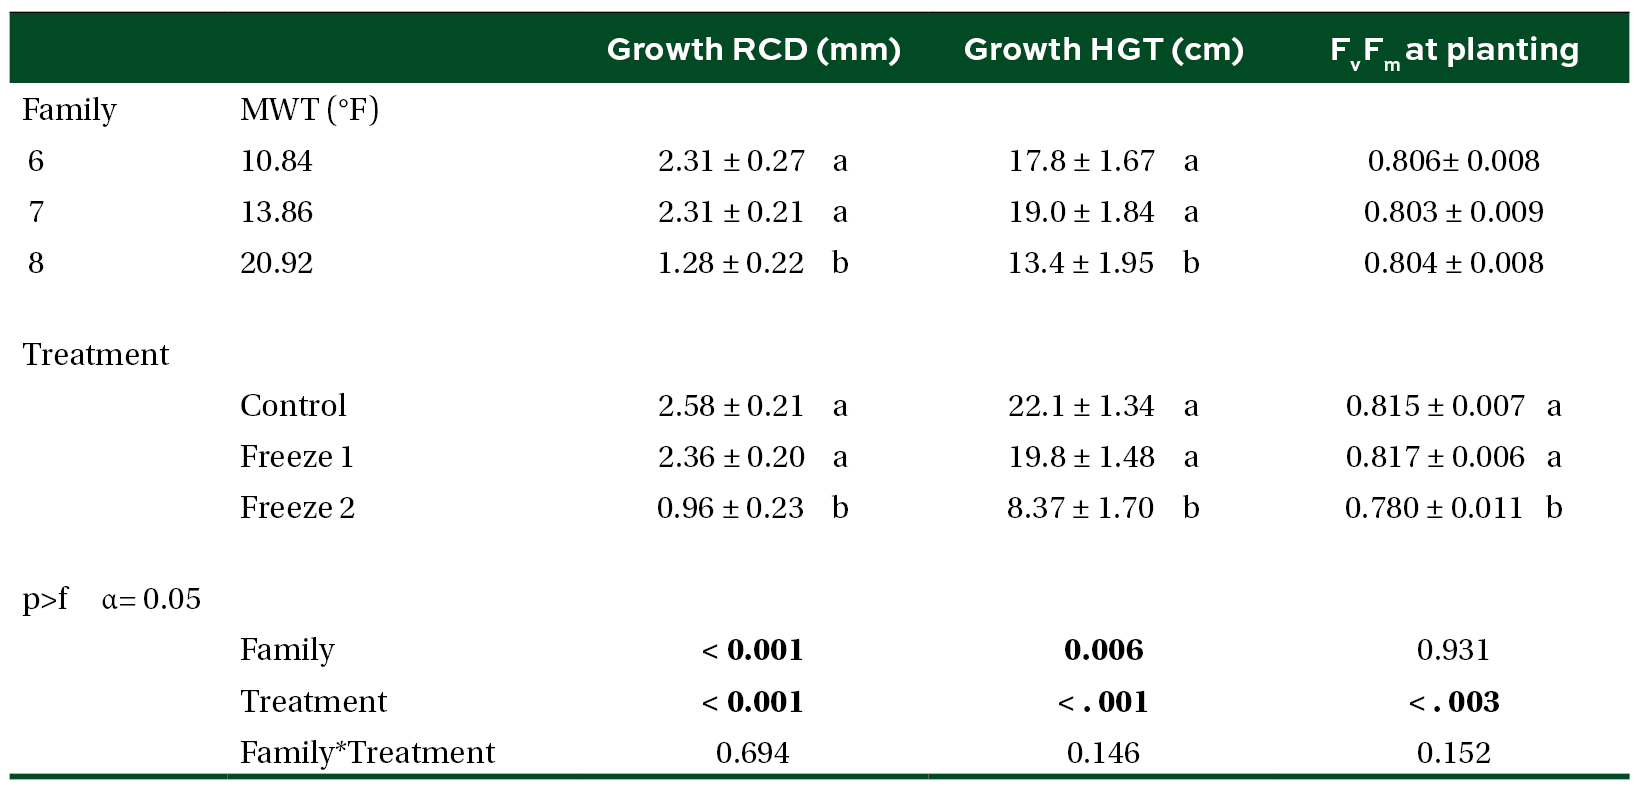
Table 5. Mean (±SE) mortality of seedlings planted at the outplanting site by MWT family, treatment, and planting time post experimental freeze. Different letters and bold indicate significant difference in means (α = 0.05).
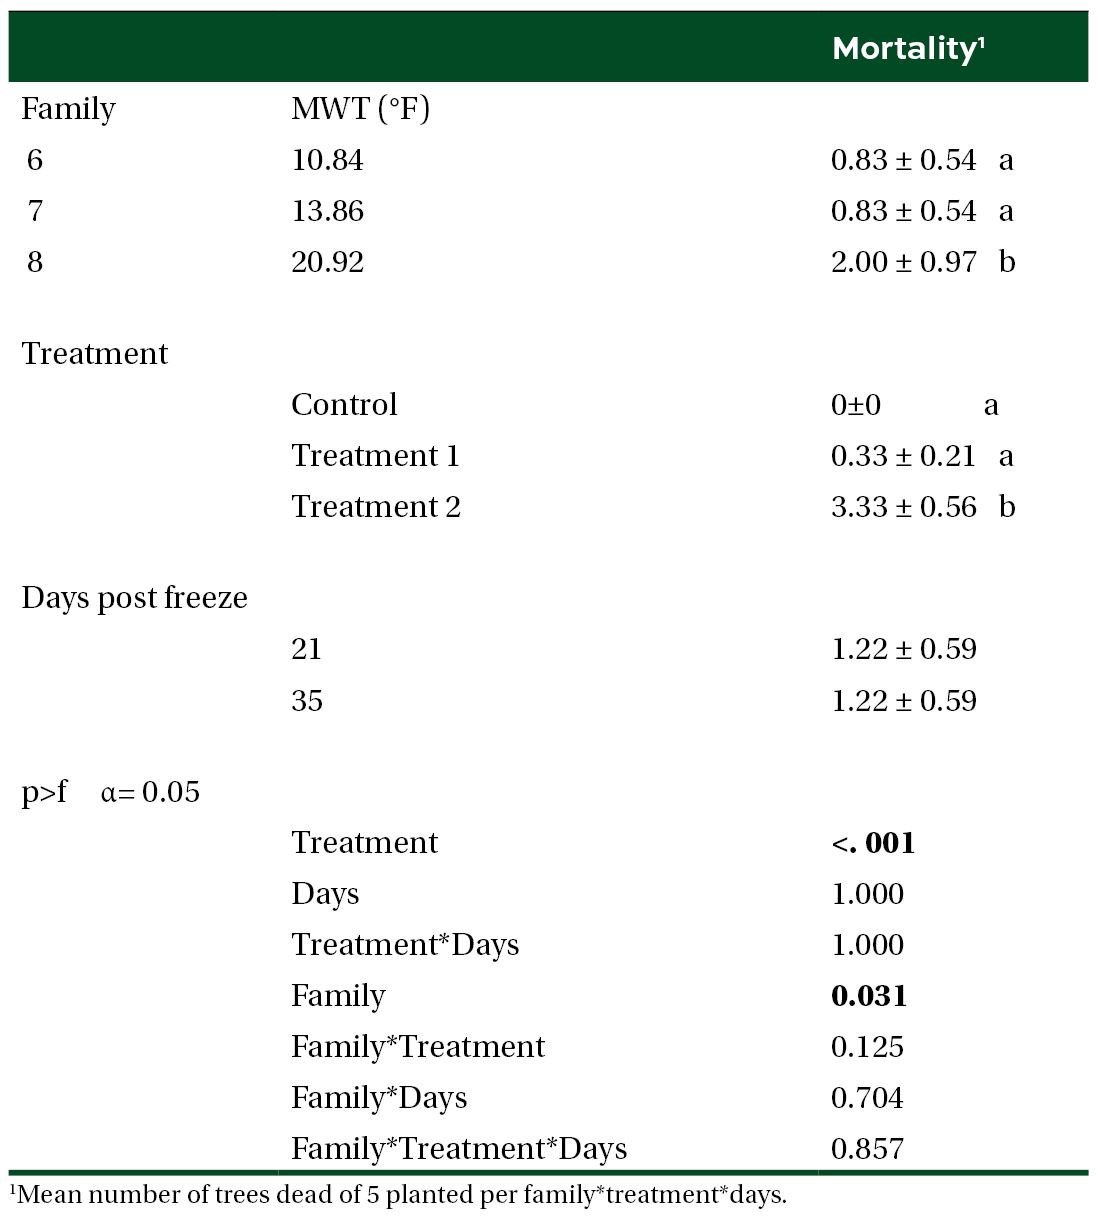
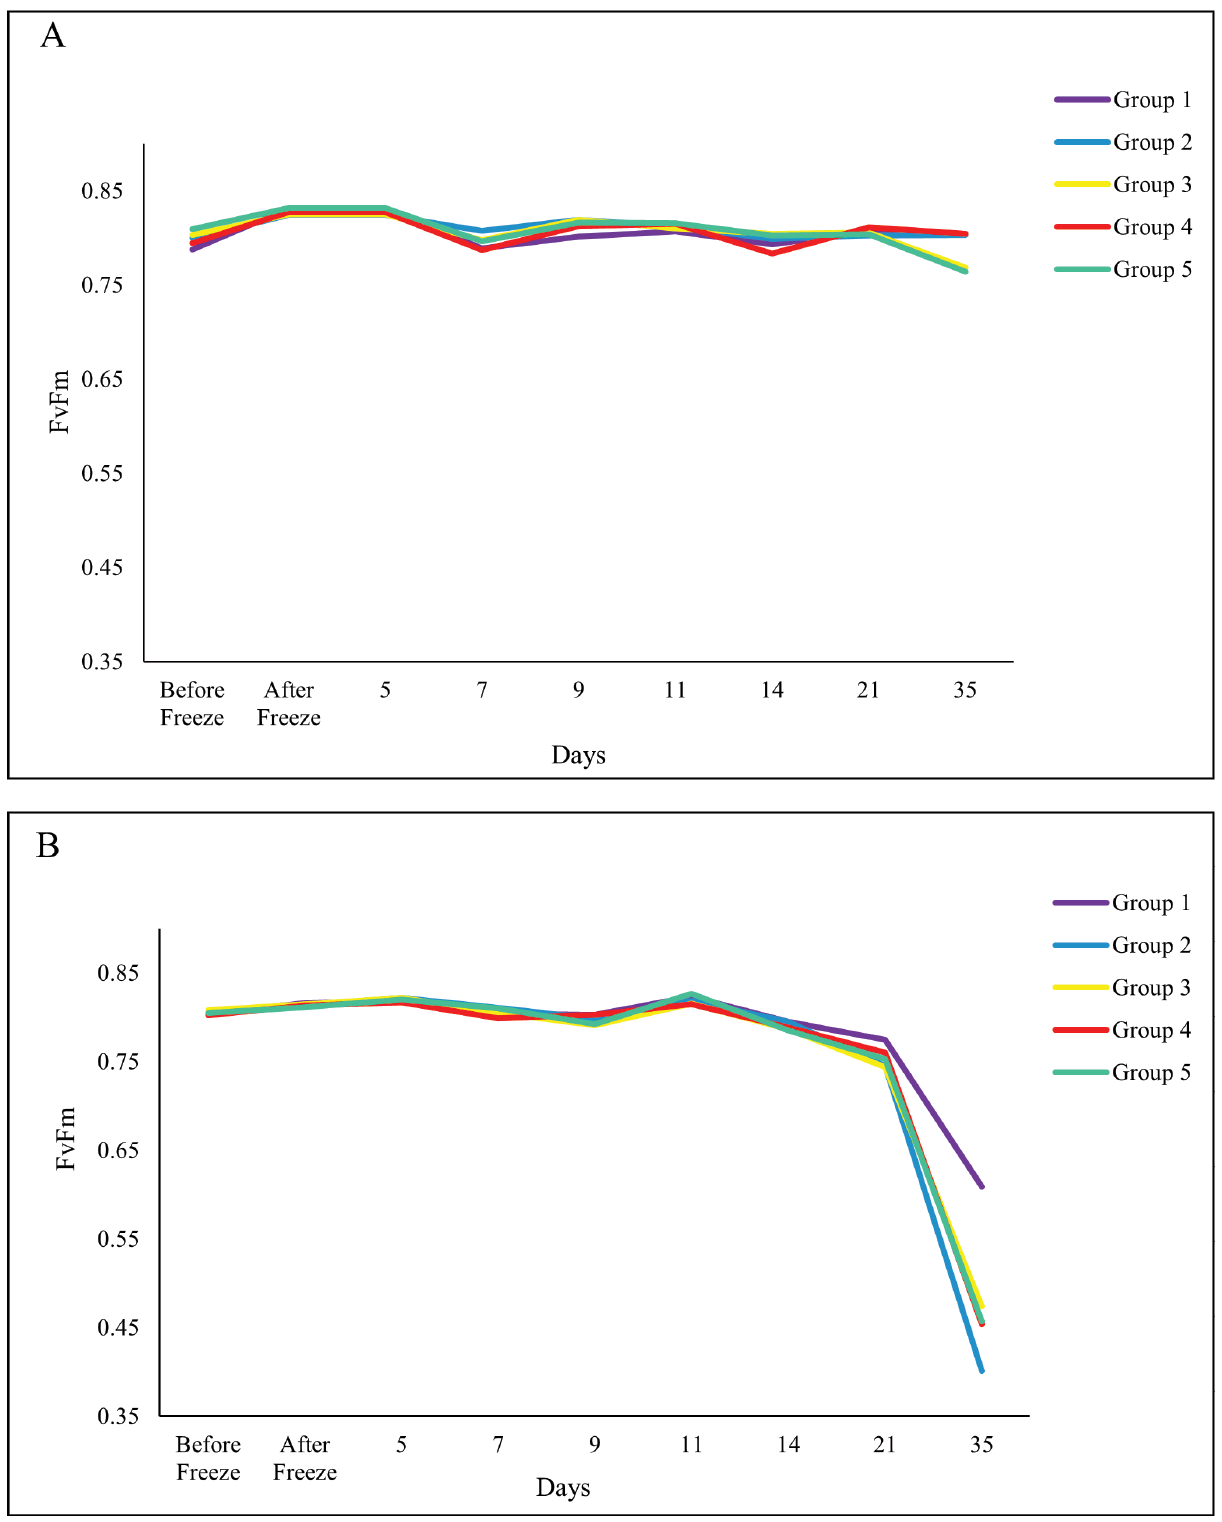
Figure 1. Measures of FvFm before experimental freeze to planting at the stress facility of (A) ambient conditions (control treatment) and (B) experimental freeze of 15˚F for 3 days (freeze treatment).
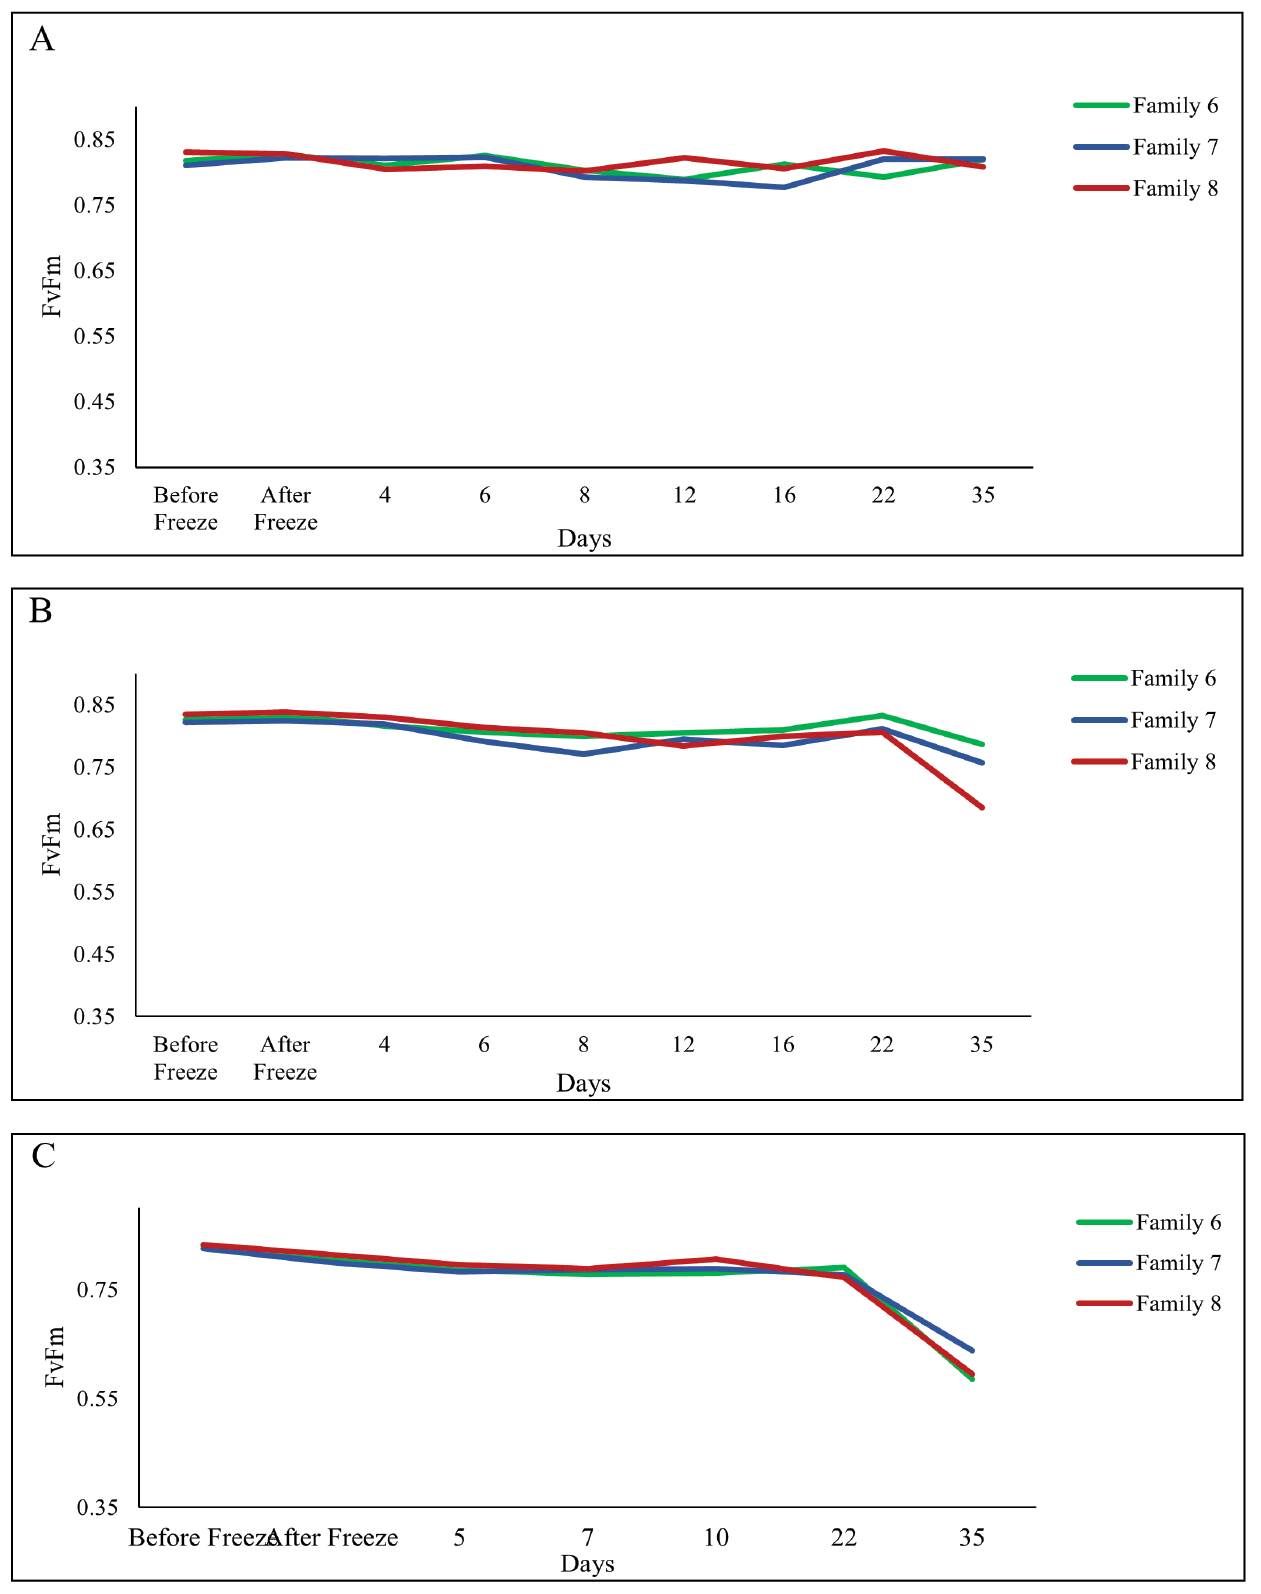
Figure 2. Measures of FvFm before experimental freeze to planting at the outplanting site of (A) ambient conditions (control treatment), (B) experimental freeze of 15˚F for 1 day (freeze treatment 1) and (C) experimental freeze of 15˚F for 3 days (freeze treatment 2).
Introduction
Sudden freeze events present an important challenge for forest seedling production in the southeastern United States. These occurrences are even more detrimental when preceded by above-normal warm temperatures. Although seedlings become cold-acclimated when there is a reduction in temperatures and photoperiod, they can quickly de-acclimate with atypical warm weather during winter months. Freeze damage to seedlings can cause significant mortality when outplanted, as there are other harsh conditions that exist on planting sites. It can take more than two weeks for freeze damage to be evident and nursery managers may unknowingly ship unhealthy seedlings to their customers. Nurseries are therefore in need of a method that can rapidly assess freeze damage before visible signs of damage.
Chlorophyll fluorescence has been widely used to assess plant damage when exposed to various biotic and abiotic stresses such as salinity, drought, herbicide, and heat (1, 2, 3, 4, 5, 6, 7, 8, 9, 10, 12, 13, 14). Measures of chlorophyll fluorescence can uncover the effect of these stresses on photosynthetic processes. It provides information on the state of the photosynthetic efficiency in photosystem II (PSII) using the variable fluorescence to maximum fluorescence (Fv / Fm) index, which is a reliable indicator of reductions in the photosynthetic capacity of a plant. Damage to PSII by cold temperatures can therefore be assessed using this method.
In a previous study done by the SFNMC (Research Report 21-03), the degree of damage and the likelihood of future damage by an experimental freeze was detectable using chlorophyll fluorescence. The aim of this study was to:
- simulate typical freezing temperatures experienced in the southeastern US, as the previous experimental freeze was too harsh.
- monitor growth after outplanting to understand the long-term impacts of freeze damage on seedling development.
- evaluate the time needed for seedlings to sufficiently recover and survive outplanting after a freeze.
- further assess whether chlorophyll fluorescence can be used as a rapid, low-cost tool in forest nurseries.
Methodology
Experimental design (stress facility)
There were 10 genetic families included in this study. They were split into five groups of two families according to similar (within 2°F of each other) yearly average minimum winter temperature (MWT) at the seed source origin (Table 1). There was a total of 32 seedlings per MWT group. Seedlings were cold acclimated before being placed in a chest freezer, controlled by a 2-stage digital temperature thermometer set at 50°F for 1 hour. The temperature was reduced at a rate of 8°F per hour until a minimum temperature of 15°F was reached. Seedlings were left in the freezer at 15°F for 3 days (freeze 2), then subjected to an incremental temperature increase of 8°F per hour to 50°F before being placed in the greenhouse. Another 32 untreated seedlings were left in the greenhouse as the control group. Half (16 trees) of the seedlings from each MWT and treatment groups were planted in sand boxes at a stress facility after 21 days and the other after 35 days in greenhouse. Plants were irrigated every 3 days. The experiment was conducted using a split-split plot design with four replicates. Treatments of control of freeze 2 were assigned to main plots, number of days in greenhouse (21 or 35) to subplots, and MWT groups to sub-subplots.
Experimental design (outplanting site)
There were 3 genetic families used in this study with yearly average MWT at the seed source origin from 10-20°F (Table 1). Seedlings were treated as with those planted in the stress facility but a second treatment, 15°F for 1 day was also done. Seedlings were outplanted at a site on Auburn University’s campus and exposed to natural conditions. A completely randomized design was used to conduct the experiment. Five seedlings were planted from each family and treatment after 21 and 35 days in the greenhouse.
Measurements and analyses
A handheld chlorophyll fluorometer (OS30p+, Opti-Sciences Inc. NH) was used to measure light adapted chlorophyll fluorescence (Fv / Fm) on all seedlings before and after the experimental freeze, in two-day increments after being placed in the greenhouse, and before being outplanted. Measures of root collar diameter (RCD) and height were taken before and after freezing seedlings in March, and in August when seedlings were lifted from the sand in the stress facility and outplanting site. Seedling mortality was also assessed using a visual rating scale and rated by three different evaluators once per week for 5 weeks after planting. The average rating was then used to represent each week. After 150 days post-planting, a final mortality count was conducted. Analyses were done using the R Statistical Software (v4.1.2; R Core Team 2021).
Results and Discussion
We were unable to reestablish the relationship between initial percent reduction in FvFm and percent foliar damage post experimental freeze that was reported in the previous study (Research Report 21-03). An FvFm value in the range of 0.79 to 0.84 is ideal with lower values indicative of plant stress. Significant reductions of FvFm in this case were not observed until 21 days post freeze when plants were also showing visible signs of stress (Figures 1 and 2). Significant differences in growth and mortality were only observed between treatments in the stress facility (Tables 2 and 3). At the outplanting site, where plants were not irrigated and conditions were more similar to operational planting sites, there were significant differences in growth and survival between different treatments as well as families. The family with the highest MWT, family 8, had reduced growth and a higher mortality (Tables 4 and 5).
Holding seedlings in the greenhouse for two additional weeks to aid recovery did not change survival outcomes (Tables 3 and 5). Our results also suggest that seedling survival rates after a freeze may be highly dependent on the length of time that they are exposed to freezing temperatures. Survival of seedlings that were exposed to 10˚F for 1 day was not significantly different from the control but significant mortality was observed for those exposed to 10˚F for 3 days (Table 5).
Management Implications
Measures of chlorophyll fluorescence are usually able to detect plant stress early on. This technique for rapid detection of plant damage in nurseries is promising but will need further refinement.
Acknowledgements
We would like to thank Trevor Walker and Austin Heine from the Tree Improvement Program at North Carolina State University for providing the loblolly pine seeds and their invaluable advice, and Tom Stokes from the Weyerhaeuser group for his technical assistance. We would also like to thank the PRT-International Forest Company for growing the seedlings used in this project.
References
Arief, M.A.A.; Kim, H.; Kurniawan, H.; Nugroho, A.P.; Kim, T.; Cho, B.-K. Chlorophyll fluorescence imaging for early detection of drought and heat stress in strawberry plants. Plants 2023, 12, 1387.
Bresson, J.; Vasseur, F.; Dauzat, M.; Koch, G.; Granier, C.; Vile, D. Quantifying spatial heterogeneity of chlorophyll fluorescence during plant growth and in response to water stress. Plant Methods 2015, 11, 23.
Guidi, L.; Landi, M.; Penella, C.; Calatayud, A. Application of modulated chlorophyll fluorescence and modulated chlorophyll fluorescence imaging in studying environmental stresses effect. Ann. Bot. 2016, 6, 5–22.
Juneau, P.; Qiu, B.; Deblois, C.P. Use of chlorophyll fluorescence as a tool for determination of herbicide toxic effect: Review. Toxicol. Environ. Chem. 2007, 89, 609–625.
Legendre, R.; Basinger, N.T.; van Iersel, M.W. Low-cost chlorophyll fluorescence imaging for stress detection. Sensors 2021, 21, 2055.
Moustakas, M.; Calatayud, A.; Guidi, L. Editorial: Chlorophyll fluorescence imaging analysis in biotic and abiotic stress. Front. Plant Sci. 2021, 12, 658500.
Moustakas, M.; Guidi, L.; Calatayud, A. Editorial: Chlorophyll fluorescence analysis in biotic and abiotic stress, volume II. Front. Plant Sci. 2022, 13, 1066865.
Pérez-Bueno, M.L.; Pineda, M.; Barón, M. Phenotyping plant responses to biotic stress by chlorophyll fluorescence imaging. Front. Plant Sci. 2019, 10, 1135.
Razavi, F.; Pollet, B.; Steppe, K.; Van Labeke, M.-C. Chlorophyll fluorescence as a tool for evaluation of drought stress in strawberry. Photosynthetica 2008, 46, 631–633.
Sommer, S.G.; Han, E.; Li, X.; Rosenqvist, E.; Liu, F. The chlorophyll fluorescence parameter Fv/Fm correlates with loss of grain yield after severe drought in three wheat genotypes grown at two CO2 concentrations. Plants 2023, 12, 436.
Stokes, T.; Nadel, R.; Aspinwall, M.; Payn, K.; Payne, N.; Enebak, S. Rapid determination of freeze damage to loblolly pine seedlings. Southern Forest Nursery Management Cooperative 2021.
Woolery, P.O.; Schmal, J.L.; Davis, A.S. Evaluation of chlorophyll fluorescence as an indicator of dehydration stress in American chestnut seedlings. Nativ. Plants J. 2010, 11, 27–32.
Zhang, C.; Zhou, L.; Xiao, Q.; Bai, X.; Wu, B.; Wu, N.; Zhao, Y.; Wang, J.; Feng, L. End-to-end fusion of hyperspectral and chlorophyll fluorescence imaging to identify rice stresses. Plant Phenomics 2022, 2022, 9851096.
Zhu, J.K. Abiotic stress signaling and responses in plants. Cell 2016, 167, 313–324.